
Saved targets in folders
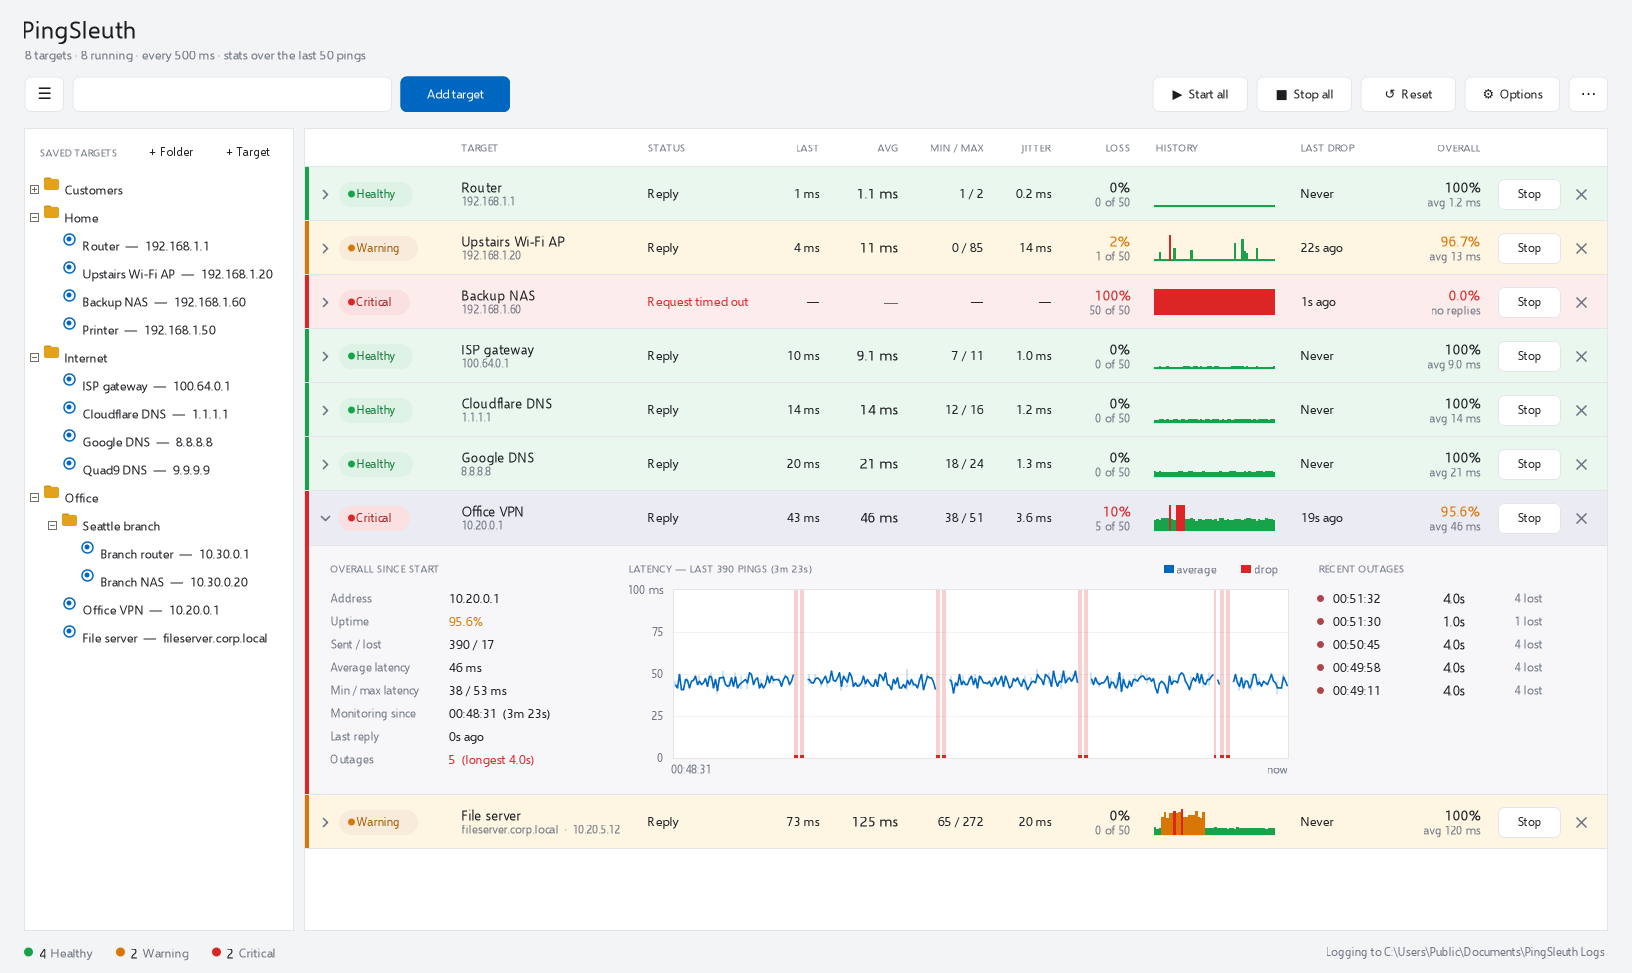
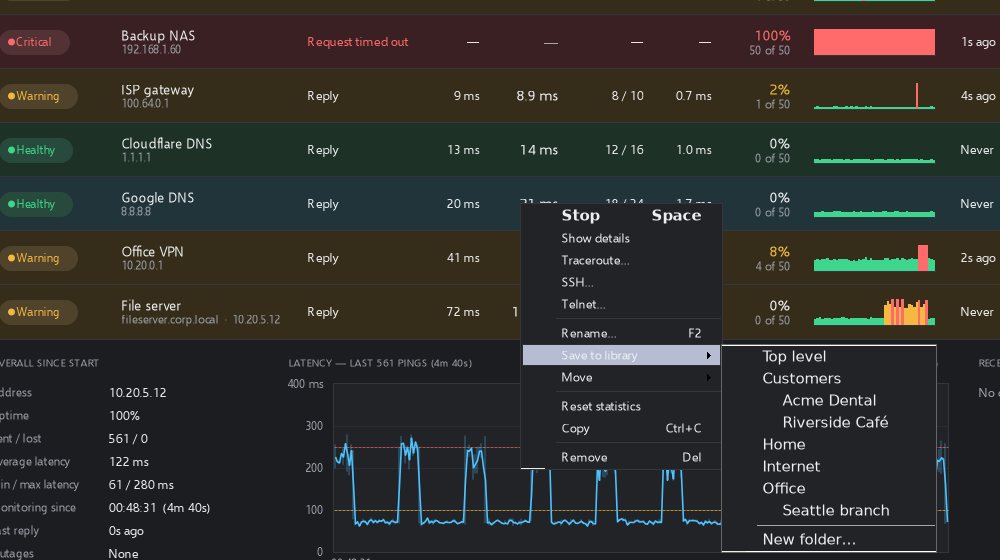
Organise hosts by site, customer or room in folders and subfolders. Drag and drop to rearrange, double-click to monitor one, or start a whole folder at once.
When your connection is unstable but you don't know why, PingSleuth can help narrow it down. Ping every link in the chain at once from one window to find which is failing. No more using multiple command prompts for ping -t. Save your common targets, initiate traceroute or SSH, set failure thresholds, log to a file, and more.
 PingSleuth
features
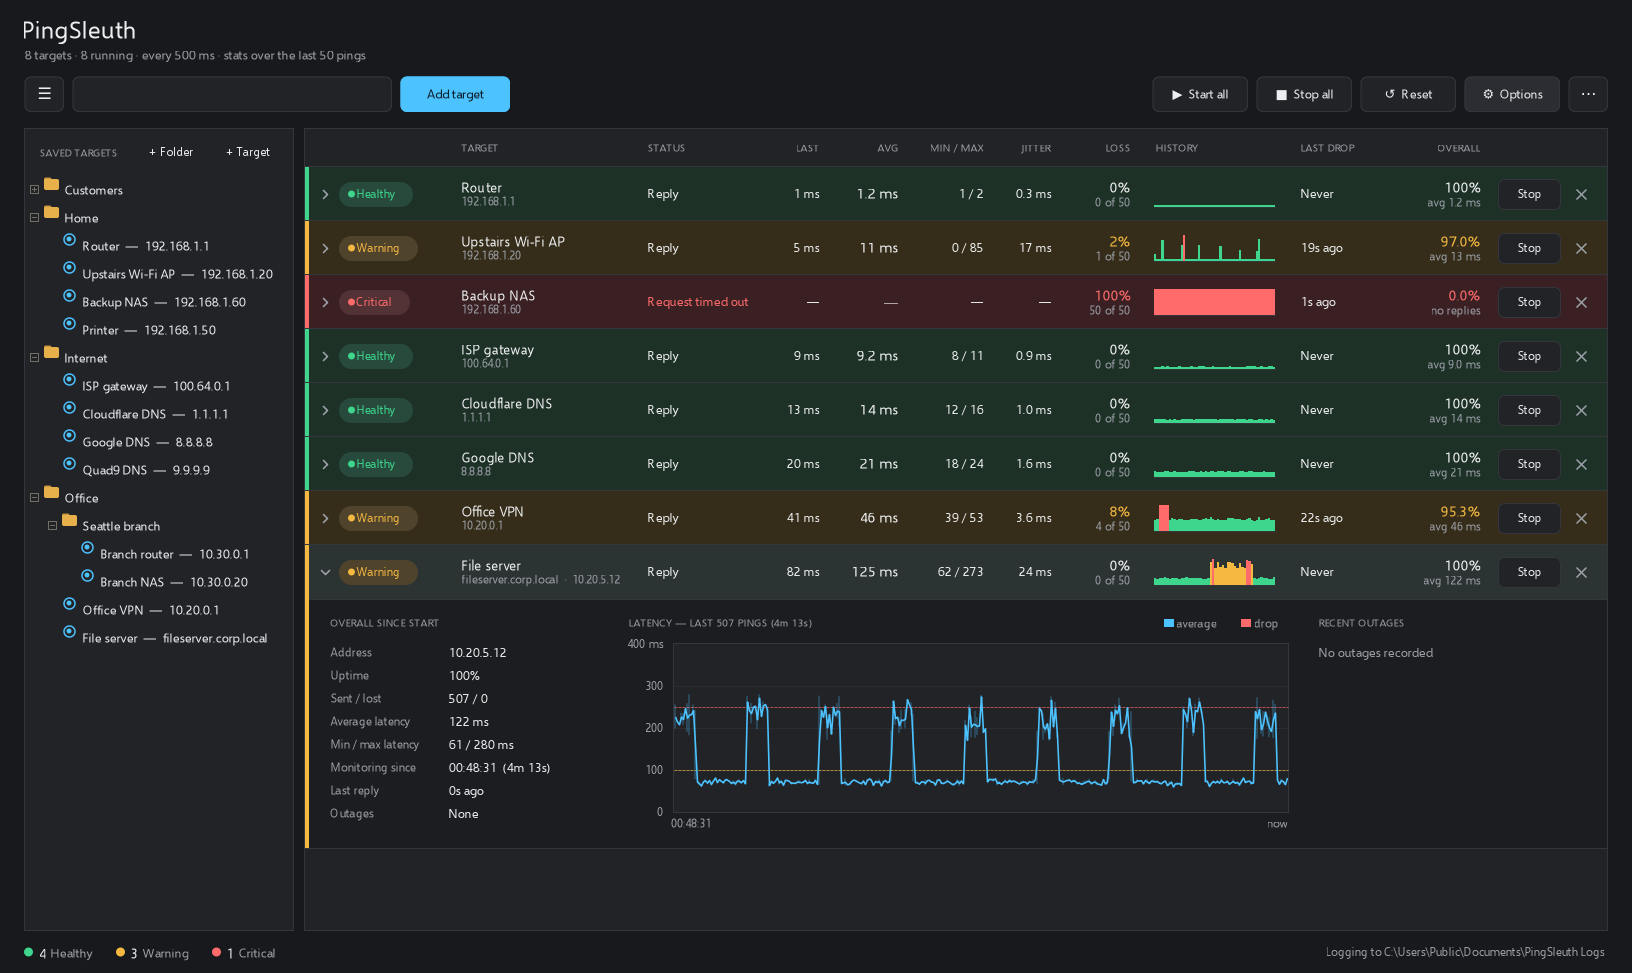
Each target gets its own row with live stats over the last 50 pings: packet loss, average, min and max latency, jitter, time since the last drop, and a bar chart of recent history.
drill down
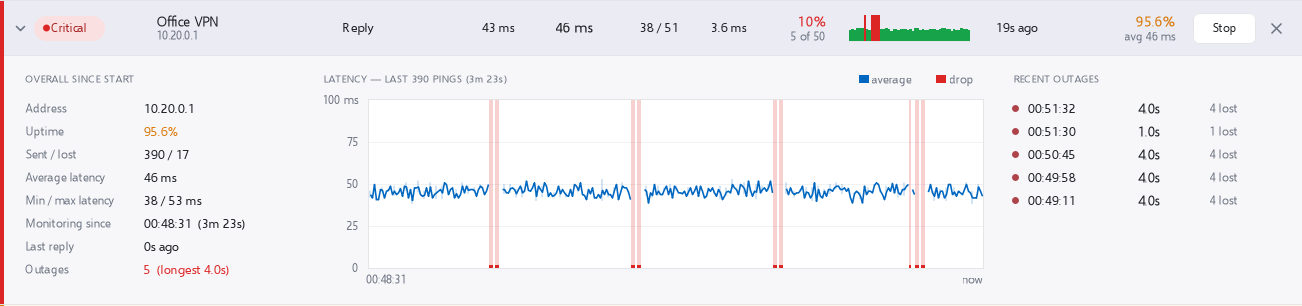
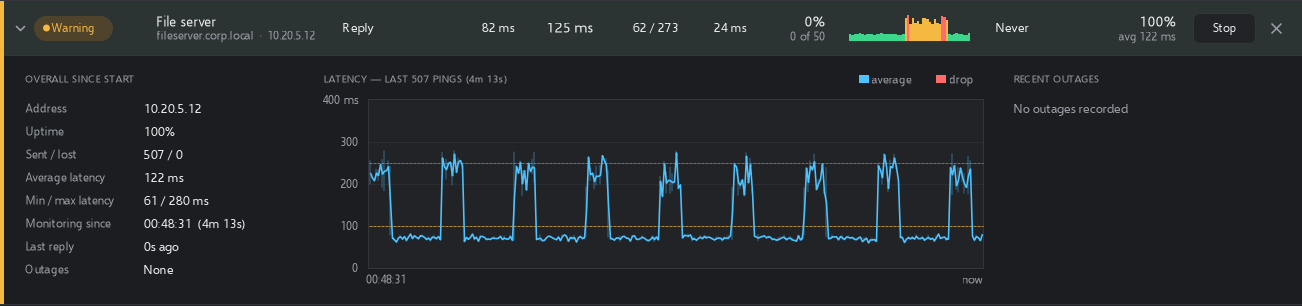
See a chart covering up to the last 3,600 pings, with every drop marked. Beside it are uptime and average latency since monitoring started, and a list of recent outages with how long each lasted and how many pings were lost.
traceroute
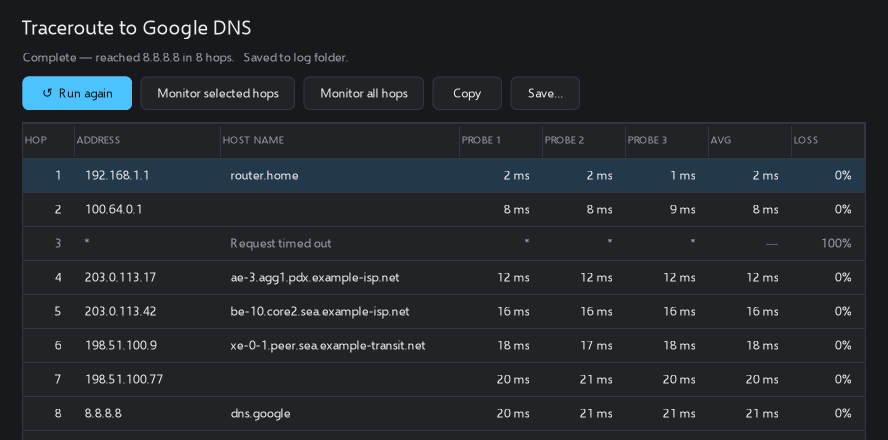
Run a traceroute to any target and see each hop with its host name and response times. Spot something odd? Start monitoring the hops you pick, or all of them, in one click.
right-click
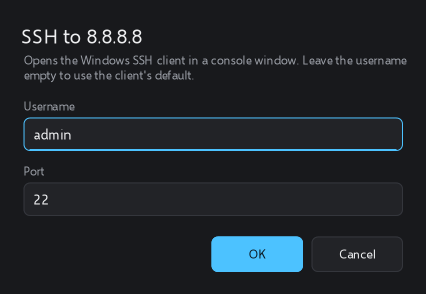
Right-click any row to open an SSH or Telnet session with the client of your choice.
thresholds
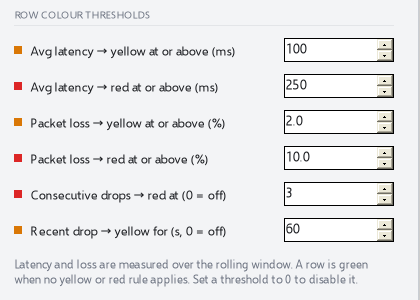
Rows turn green, yellow or red based on your rules for latency, packet loss, and more, all measured over the rolling window.
everything else
Organise hosts by site, customer or room in folders and subfolders. Drag and drop to rearrange, double-click to monitor one, or start a whole folder at once.
Every ping and every outage is written to plain text files, one per target per day, that open cleanly in Excel. Traceroutes are saved too.
Your saved targets and settings are waiting next time you open it, and PingSleuth can start pinging them as soon as it launches.
A small bar chart of the last 50 pings on each row, so flapping connections stand out at a glance.
Give targets friendly names like "Upstairs Wi-Fi AP" and drag rows into whatever order makes sense to you.
Follows your Windows theme by default, or pick one yourself in Options.
coming soon
Next time the network acts up, open it, add a few targets, and see what's breaking.